
Thinking about buying or selling a home?

Click the button below to talk to a Realtor® (or text 805-600-0677).

Paso Robles Real Estate Market Update – July 2026

Canva - Market Update - July 2026 - June data

Introduction

The Paso Robles housing market gained momentum in May, with buyer activity increasing, homes selling more quickly, and prices reaching new highs. While inventory continued to grow, demand kept pace, creating a market that remains active and healthy despite broader economic uncertainty.

The latest numbers suggest buyers are finding reasons to move forward, while sellers who price and present their homes well continue to be rewarded.

📊Paso Robles Market Snapshot

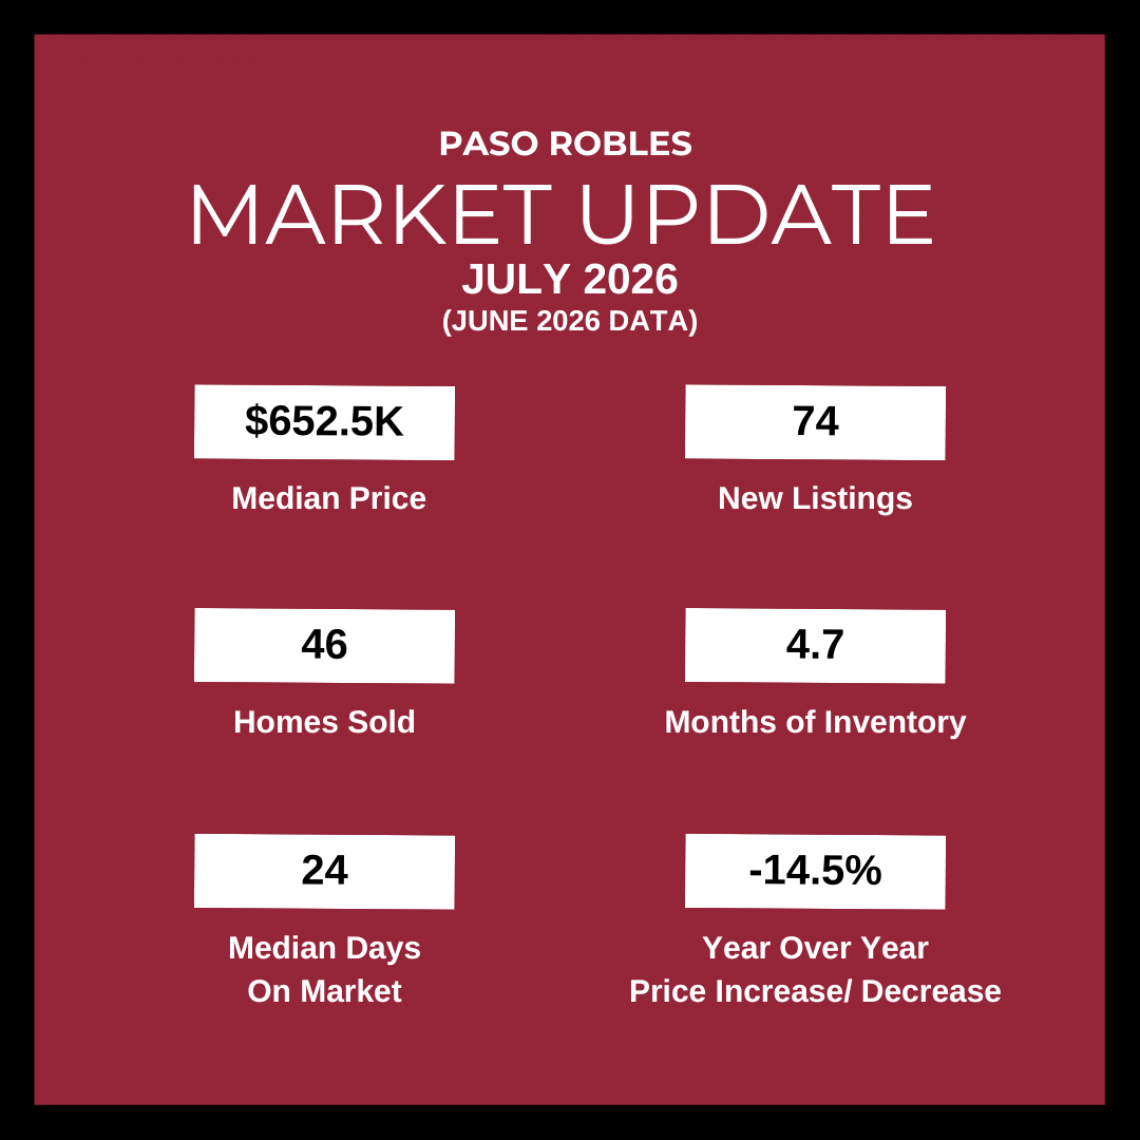
  • New Listings: 74 (down from 78 last month, up from 66 last year)
  • Active Listings: 217 (up from 191 last month and 191 last year)
  • Pending Sales: 36 (down from 57 last month and 41 last year)
  • Closed Sales: 46 (up from 41 last month, down from 57 last year)
  • Median Days on Market: 24 (up from 9 last month and 12 last year)
  • Median Sale Price: $652,500 (down from $820,000 last month and $763,420 last year)
  • Median Price per Sq. Ft.: $403 (down from $432 last month and $421 last year)
  • Months of Supply: 4.7 (up from 4.1 last month, slightly below 4.9 last year)

🪧New Listings

June 2026: 74
May 2026: 78
June 2025: 66

➡️ What This Means:

New listings remained strong in June, staying close to May’s level and exceeding last year’s activity. Sellers continue to enter the market, providing buyers with more options than they had a year ago.

📈Active Listings

June 2026: 217
May 2026: 191
June 2025: 191

➡️ What This Means:

Inventory saw a significant increase, rising 13.6% from May and nearly 14% from last year. This is one of the clearest signs that the market is becoming more balanced. Buyers have more choices and may feel less pressure to make immediate decisions.

📝Pending Sales

June 2026: 36
May 2026: 57
June 2025: 41

➡️ What This Means:

Pending sales dropped noticeably from both last month and last year, suggesting buyers are taking more time to evaluate their options. Rising inventory and affordability concerns may be contributing to a slower pace of contract activity.

✅ Closed Sales

June 2026: 46
May 2026: 41
June 2025: 57

 ➡️ What This Means:

Closed sales improved from May but remain below last year’s level. This suggests that while transactions are still occurring at a healthy pace, the market isn’t moving quite as aggressively as it was a year ago.

💰Home Prices

Median Sale Price

June 2026: $652,500
May 2026: $820,000
June 2025: $763,420

Average Sale Price

June 2026: $673,021
May 2026: $954,631
June 2025: $834,199

➡️ What This Means:

Prices declined from May’s exceptionally strong numbers and also came in below last year’s levels. This doesn’t necessarily indicate a market downturn. Monthly price fluctuations are often influenced by the mix of homes that sold during the month. A larger share of entry-level or moderately priced homes can pull median and average prices lower.

📐Price Per Sq. Ft.

Median Price per Sq. Ft.

June 2026: $403
May 2026: $432
June 2025: $421

Average Price per Sq. Ft.

June 2026: $423
May 2026: $459
June 2025: $443

➡️ What This Means:

Price per square foot softened compared to both May and last year, supporting the idea that the homes sold in June were generally at lower price points. While this bears watching, a single month does not establish a trend.

⏳Days Active on Market

Median Days on Market

June 2026: 24
May 2026: 9
June 2025: 12

Average Days on Market

June 2026: 42
May 2026: 27
June 2025: 46

➡️ What This Means:

Homes are taking longer to sell than they did in May, indicating buyers have become more selective. However, the average days on market remains slightly better than last year, showing that desirable, well-priced homes are still attracting attention.

🏡Months of Supply

June 2026: 4.7
May 2026: 4.1
June 2025: 4.9

➡️ What This Means:

Months of supply increased noticeably from May, reflecting the growing inventory and slower pace of buyer activity. Even so, supply remains slightly below last year’s level, meaning the market is balanced but not oversupplied.

📊 Market Insight

The biggest story this month is the combination of rising inventory, slower pending sales, and softer pricing. Together, these metrics suggest buyers are gaining more leverage in the marketplace. Sellers can still achieve successful outcomes, but pricing, presentation, and marketing are becoming increasingly important.

In other words, the Paso Robles market appears to be transitioning from a fast-moving spring market into a more balanced summer market. Buyers have more choices and more time, while sellers should focus on positioning their homes competitively to stand out from the growing inventory.

📌 Bottom Line

The Paso Robles housing market remains healthy, but the pace has become more measured.

Inventory is rising, buyers are becoming more selective, and pricing has moderated from May’s highs. For buyers, this means more opportunities and less competition. For sellers, strategic pricing and strong presentation are becoming increasingly important.

📍 Data Source: Infosparks, CRMLS – 7/7/2026

If 2026, or even 2027 might be your year to make a move, the smartest first step is simply a conversation with an experienced, local REALTOR®

📞 Let’s talk – 805.600.0677

 Local knowledge. Real experience. No pressure—ever.

PASO ROBLES LIVING

What’s Your Home Worth?

Home Values In Your Neighborhood Have Changed. See What Your Home Is Worth Today!

I agree to be contacted by Dorian Kisch (Broker Associate, RE/MAX Parkside Real Estate #01950607 ) via call, email, and text.

To opt out, you can reply ‘stop’ at any time or click the unsubscribe link in the emails. Message and data rates may apply. Message frequency varies.